Request description
We are currently workig to improve our monitoring activity in Dynatrace, the tool used internally in our company.
We are already exploiting the following metrics :
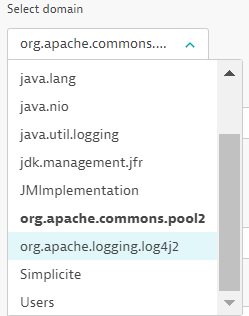
Domaine : Simplicite
- List item
- Activeusers
- Cacheobject
- Cacheobjectmax
- Cacheprocess
- Cacheprocessmax
- Contextpath
- Encoding
- Heapfreesize
- Heapmaxsize
- Heapsize
- Inactiveusers
- Licensedusers
- Pendingusers
- Sessions
- Version
Domaine : org.apache.commons.pool2
- BorrowedCount
- CreatedCount
- DestroyedByBorrowValidationCount
- DestroyedByEvictorCount
- DestroyedCount
- MaxBorrowWaitTimeMillis
- MaxIdlePerKey
- MaxTotal
- MaxTotalPerKey
- MaxWaitMillis
- MeanActiveTimeMillis
- MeanBorrowWaitTimeMillis
- MeanIdleTimeMillis
- MinEvictableIdleTimeMillis
- MinIdlePerKey
- NumActive
- NumIdle
- NumTestsPerEvictionRun
- NumWaiters
- RemoveAbandonedTimeout
- ReturnedCount
- TimeBetweenEvictionRunsMillis
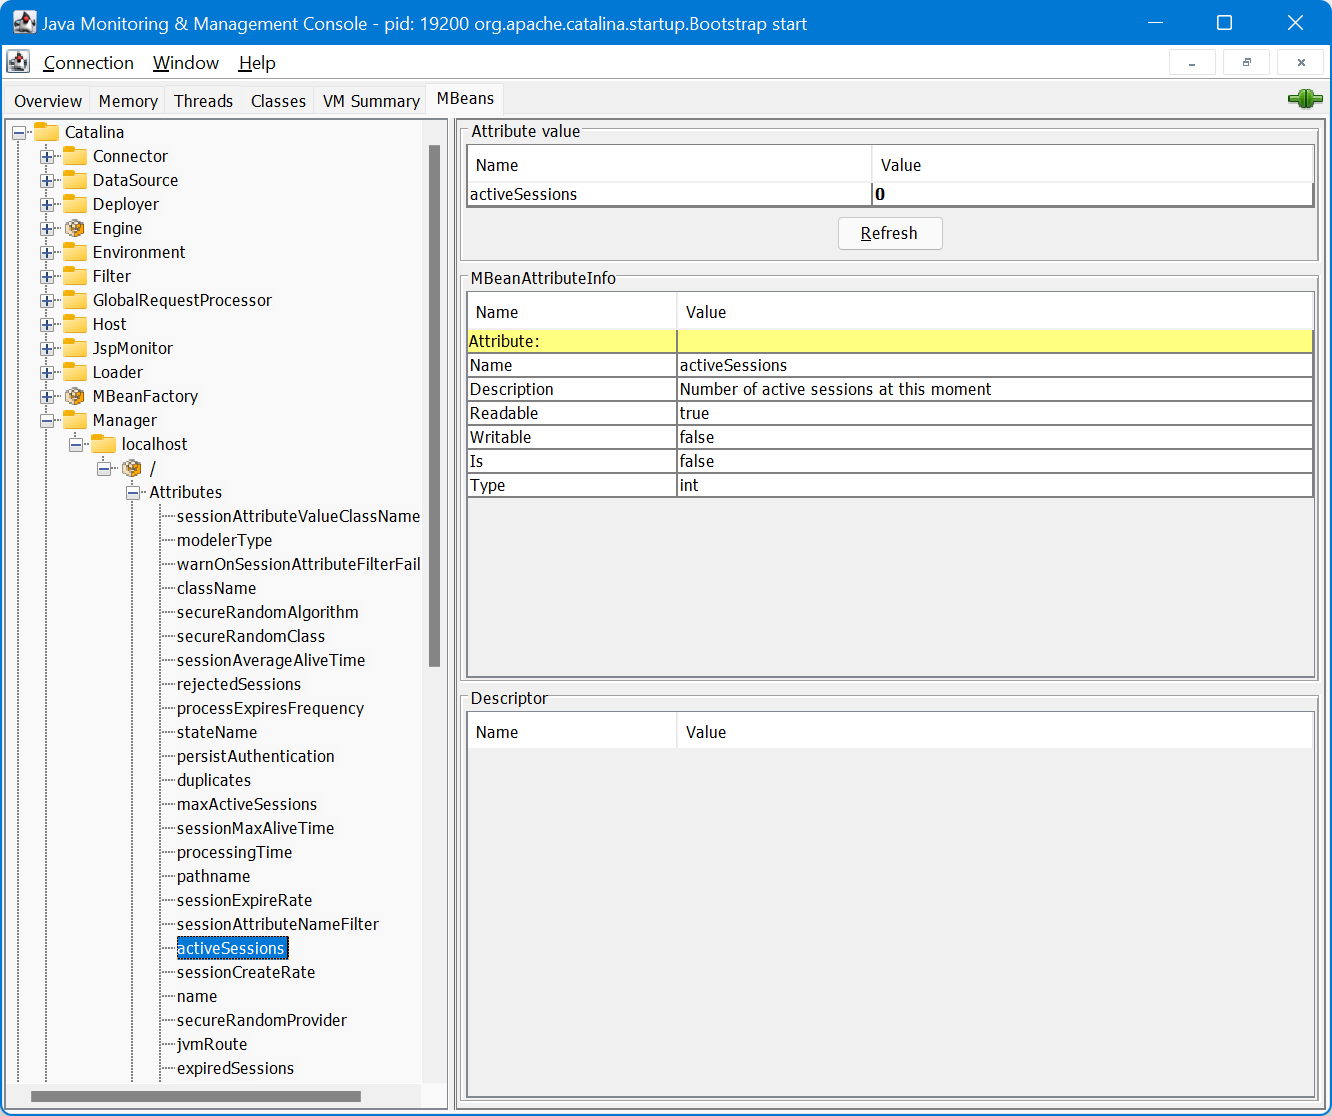
Question: Do you think about other metrics within other classes that we could exploit?
Best regards,
Thierry